Portfolio Performance
Analysis of our portfolio November 2021-October 2022
Tuesday 1 November 2022 at 12:00:00 pm AEDT 2 min readPlease click on any photo to view in a lightbox. Use arrow keys or swipe to navigate.
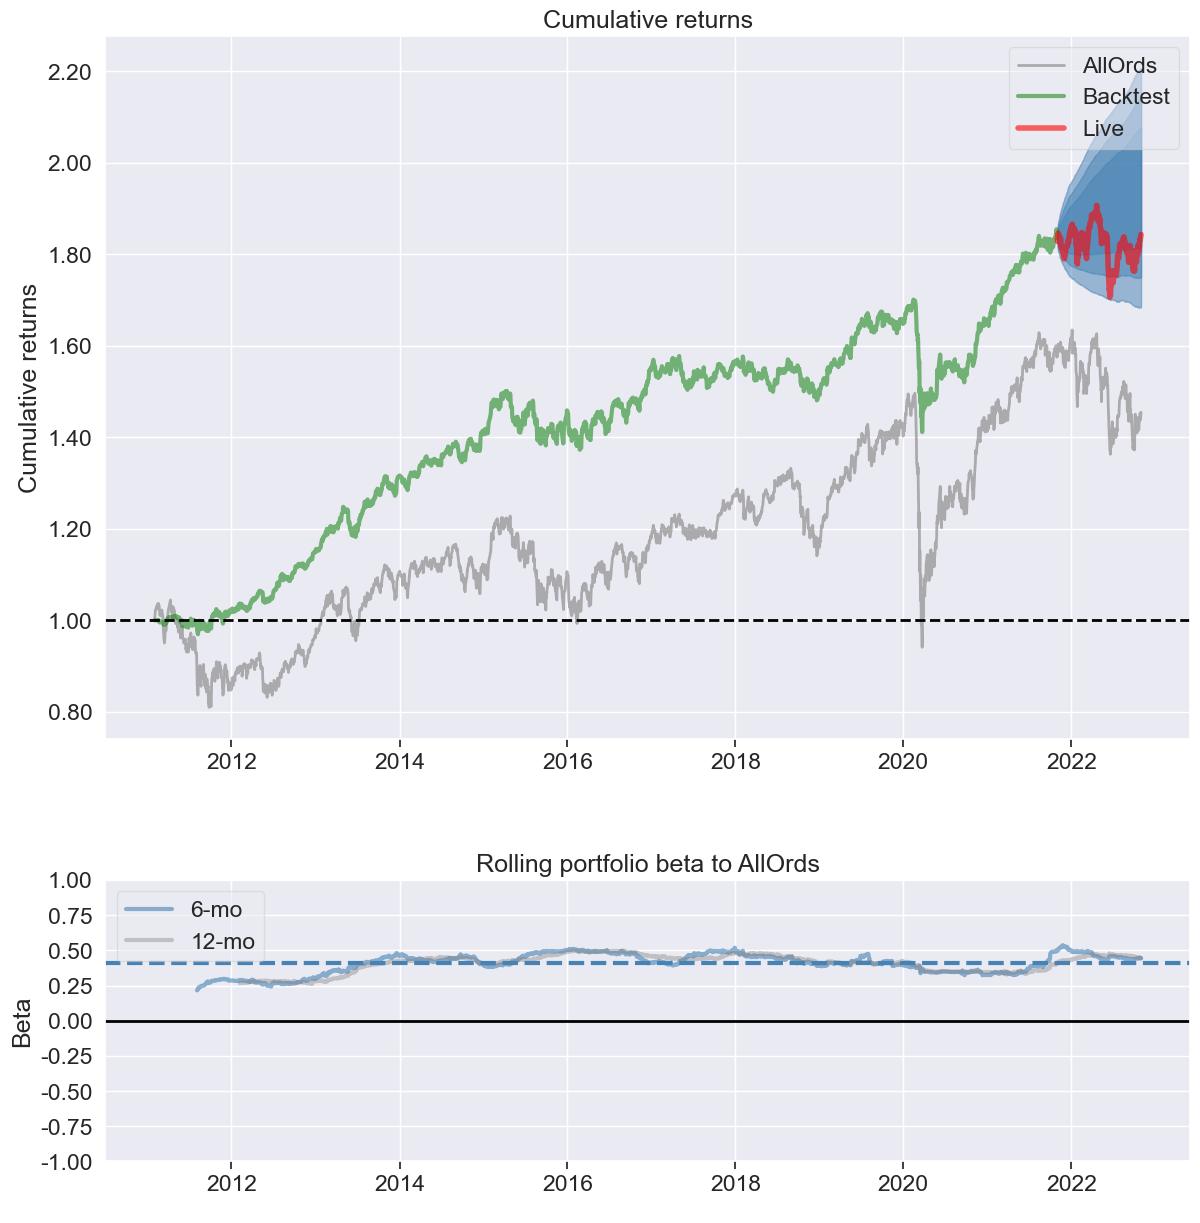
Portfolio performance 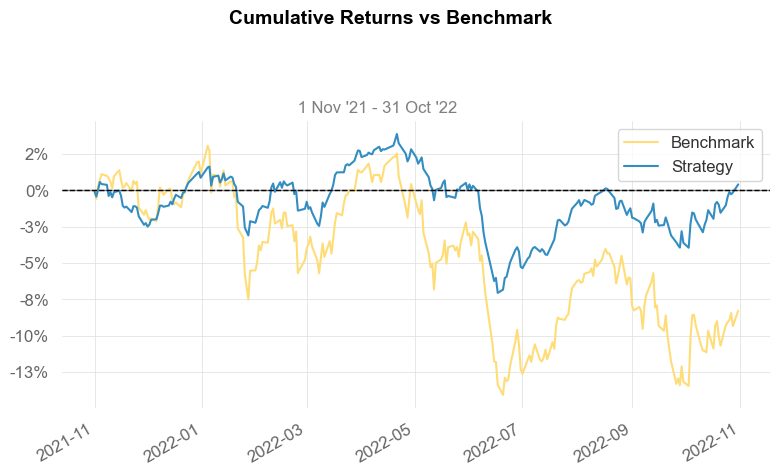 Portfolio vs benchmark
 Our portfolio performance (in terms of cumulative return) compared to All Ords since inception, and also in the last 12 months (coloured red in the first diagram). The blue cone is expected return range based on Bayesian analysis. As you can see, we did really well 2012-2016, then mediocre around 2016-2020 (during a period of low interest rates and inflated asset prices - also I was too busy working to pay attention to portfolio performance), but has performed relatively well post 2020. In the past 12 months, we’ve just about broken even against a falling market. Unlike most fund managers, I focus on maximising distribution income and minimising volatility. Our historical beta has tracked around 0.5, and in the past 12 months it’s been 0.1. A lot of funds chase alpha or Sharpe. I think in the long run, it is difficult to achieve positive alpha but it is certainly possible to manage beta, which is what I focus on using portfolio optimisation techniques. Our portfolio should be okay in the near term. Despite inflation and rising interest rates, Australian companies have had a strong reporting season. We avoid tech stocks, so we haven’t been exposed to the tech and crypto carnage. I think the heady days of cheap capital are gone and we are transitioning back to a “normal” positive yield curve which means eventually it should be attractive to hold fixed interest once again for stable incomes.